Crop Productivity Index Ratings for Minnesota
Crop productivity index ratings from the Natural Resources Conservation Service provide a relative ranking of soils based on their potential for intensive crop production. An index can be used to rate the potential yield of one soil against that of another over a period of time. Ratings range from 0 to 100. The higher numbers indicate higher production potential.
Computing the ratings
CPI ratings do not take into account climatic factors, such as the differences in precipitation or growing degree days across Minnesota. The ratings are based on physical and chemical properties of the soils and on such hazards as flooding or ponding. Available water capacity, reaction (pH), slope, soil moisture status, cation-exchange capacity (CEC), organic matter content, salinity, and surface fragments are the major properties evaluated when CPI ratings are generated. The soil properties selected are those that are important for the production of corn.
All soil component mapping phases in Minnesota were evaluated using the Cropland Productivity rule in the National Soil Information System (NASIS), and a CPI was generated for each phase. A statistical mean CPI value was created for each soil component mapping phase. All map units were populated with each component's mean CPI value, and a weighted average CPI was created for each soil map unit in the state. An individual map unit (for example, Canisteo clay loam, 0 to 2 percent slopes) will have the same CPI value wherever that map unit occurs throughout the state.
When the soils are rated, the following assumptions are made:
- adequate management
- natural weather conditions (no irrigation)
- artificial drainage where required
- no climatic factors considered
- no land leveling or terracing.
Even though predicted average yields will change with time, the productivity indices are expected to remain relatively constant in relation to one another over time.
Obtaining CPI maps and tables


Maps and tables
The Natural Resources Conservation Service provides maps and tables of crop productivity index ratings via the Web Soil Survey.
After choosing your Area of Interest and creating your soil map, go to the "Soil Data Explorer" tab and then the "Suitabilities and Limitations Ratings" tab. Choose "Vegetative Productivity", then choose "Minnesota Crop Productivity Index" (not "Crop Productivity Index"), and then click the "View Rating" button. Maps and tables can be saved or printed in PDF reports.
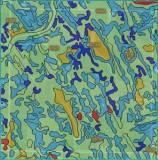
- Click on graphic to the right for a larger view of a sample map.
- Click on graphic below for a larger view of a sample table. Table content can be copied and pasted into a spreadsheet or other document.
