Minnesota Land Use/Cover: Recent (1969-present)
Land Use/Cover Home
| Quick Start |
Recent Data |
Historic Data |
Classification Systems
This page identifies modern land use/cover data and maps. Nationwide data sources are described in the first section followed by statewide sources and then regional and county sources. Note that the regional sources are usually more detailed than the state or national sources.
 Where to start?
Quick-start comparison table: An overview of Minnesota land use/cover sources by geographic area, time period, scale/resolution, classification, and data type.
National inventories
Minnesota inventories
Regional and county inventories
Contact and update information
National inventories
-
National Land Cover Data (NLCD)
NLCD 2019 offers land cover for years 2001, 2004, 2006, 2008, 2011, 2013, 2016 and 2019, along with impervious surface and impervious descriptor products updated to match each date of land cover. These products update all previously released versions of landcover and impervious products and are not directly comparable to previous products. Also included is the NLCD Land Cover Change Index which visualizes change from all 8 dates of land cover in a single layer. - GAP Land Cover
The Gap Analysis Project creates land cover datasets as part of its mission to identify habitats that need further protection. Based on the same satellite imagery that is used for the National Land Cover Data described above, its classification is more detailed and places special emphasis on natural plant communities.-
National GAP program overview from the USGS
- Upper Midwest GAP Image Processing Protocol (PDF) provides the details of the data set's creation; see Appendix A for the classification system.
-
GIS data from the Minnesota Department of Natural Resources
-
National GAP program overview from the USGS
- National Resources Inventory (NRI)
NRI is a statistically based survey that has been designed to assess conditions and trends of soil, water and related resources on non-federal lands in the United States. Initially, the Natural Resources Conservation Service conducted the inventory on a 5-year cycle (1982, 1987, 1992, 1997, 2001) but changed to an annual program starting in 2001. Data on land cover and use is one of the many attributes that NRI captures at more than 800,000 scientifically selected sample sites, of which more than 8,100 are in Minnesota.-
More information on NRI, including statistical tables, reports and procedures for obtaining data

-
More information on NRI, including statistical tables, reports and procedures for obtaining data
- Cropland Data Layer (CDL): U.S. Department of Agriculture, National Agricultural Statistics Service
This data emphasizes agricultural land cover and is produced using satellite imagery.- Cropscape viewer: View or download data; generate reports
- GIS data: Find extensive documentation and download or order data:
- Coastal Change Analysis Program, Regional Land Cover and Change:
National Oceanic and Atmospheric Administration

These nationally standardized, raster-based inventories cover coastal intertidal areas, wetlands, and adjacent uplands for the coastal U.S. Data are derived from the analysis of multiple dates of remotely sensed Landsat imagery. Data is available as individual dates of land cover and change files comparing one date to another. This 30-meter data is updated every five years using consistent procedures. - LANDFIRE: U.S. Department of Agriculture Forest Service and U.S. Department of the Interior
This multi-partner program produces consistent, comprehensive, geospatial data and databases that describe vegetation, wildland fuel, and fire regimes.-
"Existing vegetation" layers: vegetation type, canopy cover and height
-
"Existing vegetation" layers: vegetation type, canopy cover and height
- Land Use / Land Cover (LULC): U.S. Geological Survey
The 21-class LULC data was based primarily on the manual interpretation of 1970s and 1980s aerial photography.- GIS data: Read a description of the data set and download the data.
-
National Atlas of the United States, 1970:
View or download images of vegetation (maps #68-70), forests (maps #110-111), and land use (maps #112-114).


Minnesota inventories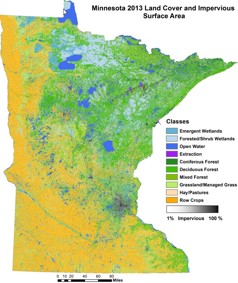
- 2013 Land Cover Classification and Impervious Surface Area by Landsat and Lidar
A 15-meter raster dataset created using a combination of multi-temporal Landsat 8 data and lidar data with object-based image analysis. - 2000 and 1990 Level 1 Landsat Landcover Classification
Seven land cover types were derived via multitemporal, multispectral supervised classification of satellite imagery. - 1990s Census of the Land
Eight categories were generalized from more detailed regional and county inventories (described below) to produce a statewide poster-size map (now out-of-print). Note that the detailed inventories were done at different time periods and used different classification systems.
- 1969: This statewide inventory classifies land use into 9 categories mapped at a 40-acre resolution.
Regional and county inventories
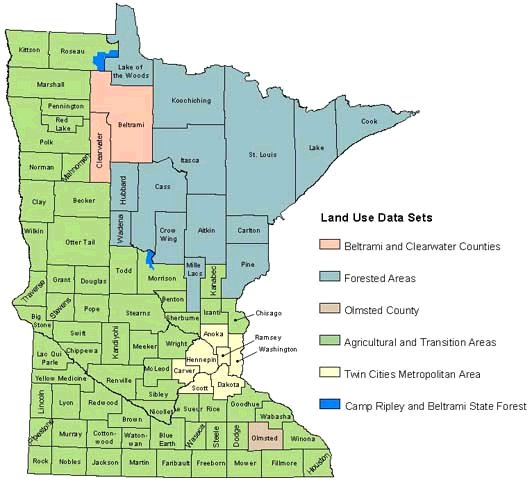
The following maps and data sets cover various regions of Minnesota. They are more detailed than the state inventories described above. See a map of areas covered by each data set. Also check county websites for planned land use or zoning maps.- Agricultural and transition counties (1988-90)
- Forested counties (1991-96)
-
Twin Cities metropolitan area (Anoka, Carver, Dakota, Hennepin, Ramsey, Scott and Washington counties; MLCCS covers portions of these counties and also includes areas in some counties near the metro)
- Land Cover 2015: A 1-meter raster dataset created using a combination of 2015 FSA NAIP data, LiDAR, and other datasets, using object-based image analysis.
- Metropolitan Council: A variety of land use datasets are available from the Minnesota Geospatial Commons, including generalized land use for 2020, 2016, 2010, 2005 and 2000, historical generalized land use (2016, 2010, 2005, 2000, 1997, 1990 and 1984 combined), 1945 and 1959 residential land use, and planned land use.
- Metropolitan Council land use maps and reports
- Minnesota Land Cover Classification System (MLCCS): This data system was developed beginning in 1998 to categorize urban and built-up areas in terms of land cover rather than land use. The project is ongoing; check DNR's status maps for geographic areas that are completed, planned and proposed.
- Land Cover and Impervious Surface Area 2002: Map and statistics; also available for 1998, 1991, and 1986. Statistics are available by county, city and township.
- Land Cover Change Classification project: This project evaluates the potential for satellite remote sensing for land cover classification and change analysis (Landsat, 1991 and 1998). The website contains maps, a viewer, statistics and a description of the project and is maintained by the University of Minnesota's Upper Midwest Regional Earth Science Applications Center.
- Duluth and Rochester (2015): 1-meter raster dataset created using a combination of 2015 FSA NAIP data, LiDAR, and other datasets, using object-based image analysis.
-
Olmsted County (1992 and 2000)
- GIS data: 2000 data that follows the MLCCS classification
- Map: based on 1992 data
- Clearwater and Beltrami Counties (1986)
- Camp Ripley and Beltrami Island State Forest, in Morrison and Roseau counties (1992-96)
- Minnesota County Biological Survey Native Plant Community and Rare Species (ongoing since 1987)
- GIS data: Native Plant Communities; Railroad Rights-of-Way Prairies; Sites of Biodiversity Significance
-
Maps,
including extent of Minnesota's native prairie in 2008.

-
Voyageurs
National Park, in northern St. Louis County
The park's vegetation mapping program has produced maps and GIS data. -
Upper Mississippi River System USGS, Upper Midwest Environmental Sciences Center
In Minnesota, this data includes land cover along the Mississippi River from the Twin Cities south to Iowa, plus the lower Minnesota and lower St. Croix Rivers. Years include: 2010, 2000, 1998, 1995, 1994, 1991, 1989, 1975, and 1890's. Level of detail, area covered, and source of data varies greatly by year. The site provides a viewer and GIS data.

Contact and update information
The information on this site represents MnGeo's most up-to-date understanding of land use/cover data for Minnesota. If you know of other publicly available land use/cover information sources, please contact us at: gisinfo.mngeo@state.mn.usReturn to MnGeo's main Land Use/Cover page